Computer-Vision-Project
Project for CS639 at UW Madison
Object Pose Tracking in 3D Space by Using Two Webcams
Do-Men Su, Bo-Hsun Chen
I. Introduction
Estimating object pose is an important research in computer vision and can ben utilized in many application, and some research papers proposed state-of-the-art algorithms to detect object orientation pose by using RGBD data, which are listed in the website [1].
Finn et al. [2] addressed the RGB images by using a deep auto-encoder (DAE) composed of three convolutional neural layers. Creatively, it used a layer of softmax as activation functions in the end of the structure to encode the image into feature points with emphasis on object locations. However, this method is only feasible for those objects mostly seen under the same surface by the camera. It is because their algorithm is to find the pixel locations of the maximum softened values in the 2D map, so it can only be applied on 2D scenes. Xiang et al. [3] proposed PoseCNN based on convolutional neural network (CNN) structure. For each RGB image, PoseCNN firstly classifies all the image pixels into classes of objects. Secondly, for each pixel of an object, PoseCNN estimates the x and y directions which point to the center of this object in the 2D image, as well as predicting the depth from the camera to get the 3D translation. Lastly, 3D rotation data can be obtained by regressing the values in the quaternion of the object orientation. And, they built the dataset by using an RGBD camera, Asus Xtion Pro Live. Wang et al [4] proposed a framework called DenseFusion to handle RGB-D data. Firstly, DenseFusion respectively encodes the RGB image into color embedding through a CNN and the depth map into geometry embedding through the PointNet. And then, a proposed dense fusion network fuses the two types of embedding to extract pixel-wise feature embedding and estimate the pose of the object. They verified their algorithm on YCB-Video and LineMOD, and used an RGBD camera in realistic robotic grasping tasks.
However, these RGBD cameras, like Kinect v2 which has been off-produced, are too expensive or hard for ordinary people to access. And, objects in these existing training datasets are not the same as the objects to recognize in tasks. So, we proposed a cheaper way to build 3D visions and the dataset of the target object, and achieve tracking the pose of the target object in 3D space by using two webcams and based on CNN structure.
The following parts of this report are as follows. Section II describes our motivation of this project, Section III shows our approaches in this project, including experiment setup, building the training dataset, building the disparity map based on two webcams, and the CNN structure and validation. Section IV demonstrates the experiment results and Section V concludes this report.
II. Motivation
Object pose estimation in real time is an important technique in computer vision, and it can be applied in many fields. Such helpful information can facilitate many attractive ongoing researches, such as a robotic arm needs to see and judge an object precisely, so it can properly catch and grasp it. And, self-driving cars should estimate poses of pedestrians, other cars, or barriers on the street, so it can avoid them and safely drive on the road.
To estimate the object pose in 3D space, we need more than an RGB picture. However, many current research used RGB-D or point-cloud cameras, which are expensive and hard to access for ordinary people. So in this project, we try to build a custom-made RGB-D vision system composed of two easily-accessible commercial 2D webcams. And then, we try to estimate the object pose based on the images from our RGB-D vision system, so we can achieve a cheaper solution.
III. Approaches
To conduct our experiment, we first used OpenCV to take two images simultaneously from the webcams. After having multiple paired stereo images, OpenCV functions were used to generate the corresponding disparity maps. And finally, we trained the neural network models with the RGB images and the disparity maps.
Besides training the neural network model, we additionally recorded a stereo video as the testing data. In the video, we move our object around with different poses. Therefore, we utilized a histogram-based tracker and the neural network model to show the pose and position of the object in the video.
A. Experiment Setup
Our experiment setup is shown in figure 1. We tied two Logitech C310 webcams together and put them on a camera tripod. The object for our experiment was a magic cube, which was put on a black carton box.
The background was covered with black paper originally. This approach made it easier to remove the background since we only needed to erase the black parts of the images. However, when building the dataset, we found that such background caused the magic cube overexposed. Besides, the white balance and exposure time of our webcam module were measured automatically and cannot be controlled by OpenCV. Therefore, the setup shown in figure 1 used a white background instead. Such background made the automatically measured white balance and exposure time consistent throughout the experiment.
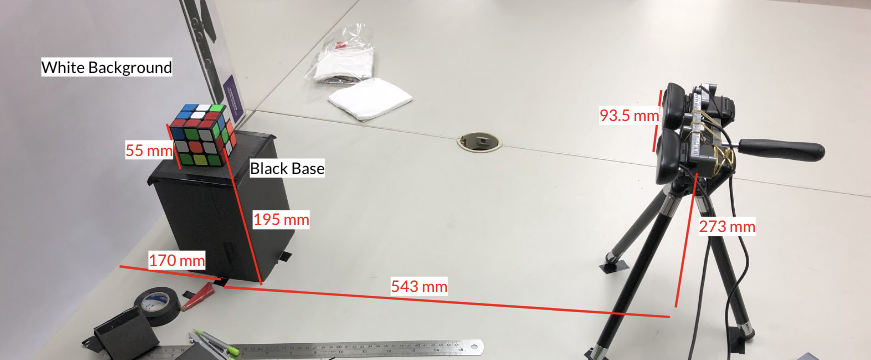
Figure 1: Experiment setup
B. Building Datasets
To build the training data, we manually rotated the magic cube on the carton box through both Y and Z axes. As shown in figure 2, X-axis pointed out of the paper, Y-axis pointed to the right, and Z-axis pointed upwards. The animation of figure 3 shows that we rotated the magic cube through Z-axis for a round; lift it up (rotation through Y-axis) and rotated it through Z-axis for another round again. As a result, we took 197 paired pictures in total as our dataset.
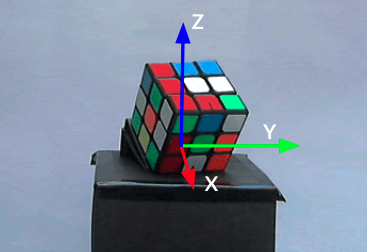
Figure 2: The three axes used to build the dataset
Figure 3: The animation of rotating the magic cube through Z axis
C. Building Disparity and Depth Maps with Two Webcams
To generate the RGB-D images from the paired RGB images, we needed some algorithms to generate the depth maps. Therefore, OpenCV functions are utilized to process the paired images. To generate the depth maps in OpenCV, we needed the following steps. The first is to generate the disparity maps. And, secondly, we needed to calibrate the cameras in order to compute the depth maps from the disparity maps. To calibrate our webcams, we originally used checkerboardPattern.pdf from Matlab.
As told in the class, the relationship of the disparity (\(d\)) and the depth (\(z\)) is shown in the following formula: \(z = \frac{bf}{d}\), where \(f\) is the focal length and \(b\) is the horizontal baseline. As we can see from our experiment setup, the baseline and the focal length were static throughout the experiment, so the depth was inversely proportional to the disparity. Since the follow-up usage of the depth maps was the neural network model, it is not meaningful to compute such linear transformation; hence, for simplicity, we took the disparity maps as the input of the neural network model instead of the depth maps.
The algorithm chosen to compute the disparity is Semi-Global Block Matching (SGBM). Using a block-based approach, the algorithm estimates the disparity from the left and the right images. This algorithm is implemented in OpenCV as cv2.StereoSGBM_create. To achieve a satisfactory result, we needed to tune a few parameters in the function. To help ourselves tunning the parameter, we built an instant GUI previewer (figure 4) of the disparity map, and listing 1 shows parameters chosen in our experiment.
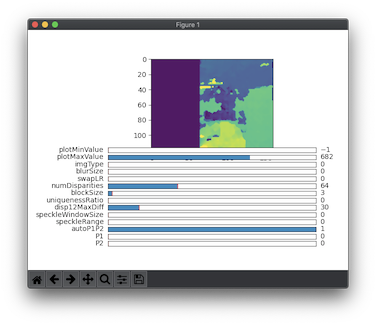
Figure 4: The GUI disparity preview tool
numDisparities: 64
blockSize: 5
uniquenessRatio: 0
disp12MaxDiff: 50
speckleWindowSize: 0
speckleRange: 0
P1: 8 * blockSize ** 2
P2: 32* blockSize ** 2
Listing 1: The parameters used for StereoSGBM_create
The meaning of the parameters and how we chose them are explained below:
numDisparitiescontrols the maximum number of pixels difference of the same point on the two images. IfnumDisparitiesis too large, the size of unused pixels would be large. The unused pixels are shown on the left side of the disparity map in figure 4. However, ifnumDisparitiesis too small, the algorithm may fail to match the corresponding pixel because their difference is larger thannumDisparities.blockSizeis the block size used to compare the two images. SmallerblockSizemakes the result more accurate but may fail in some pixels.uniquenessRatiois the threshold that measures the reliableness of disparity. The unreliable pixels would be marked as-16, which may cause additional problems for our neural network training process, so we would rather get an unreliable value instead.disp12MaxDiffis the maximum allowed difference in two images. If the value is too small, the algorithm would fail on some pixels.- The rest of the variables control the smoothness of the comparison and we set them to a suggested value in the OpenCV document.
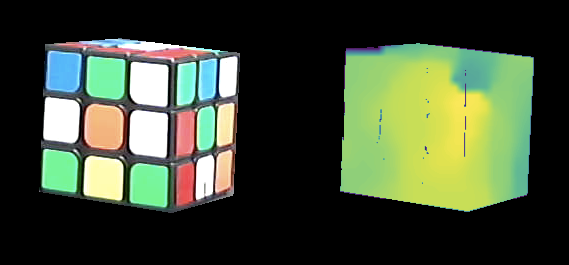
Figure 5: The RGB image and the disparity map
D. CNN Structure
We use convolutional neural network (CNN) model to infer the relationship between input images and the object orientation. There are multiple ways to represent object orientations, including rotation matrix, Euler angle, and quaternion. Since rotation matrix has 9 parameters with many constraints (orthonormal matrix), and Euler angles have the singularity problem, we use the quaternions, which use four numbers to represent the object pose, with Euclidean norm equaling to 1 as the only constraint.
For our dataset, we only collected 198 images and we did not rotate the object along the X-axis of the global frame. But, since we have aligned the camera frame to the global frame, the effect of rotating the image (along the X-axis of the camera frame) is almost equivalent to rotating the object along the X-axis of the global frame. So, we augment our dataset by rotating each original image in the dataset by specific angles (20, 40, …, 340 deg), and then we can get 18 times larger data set.
Referencing the PoseCNN structure in [3], we build our CNN structure as the following figure.
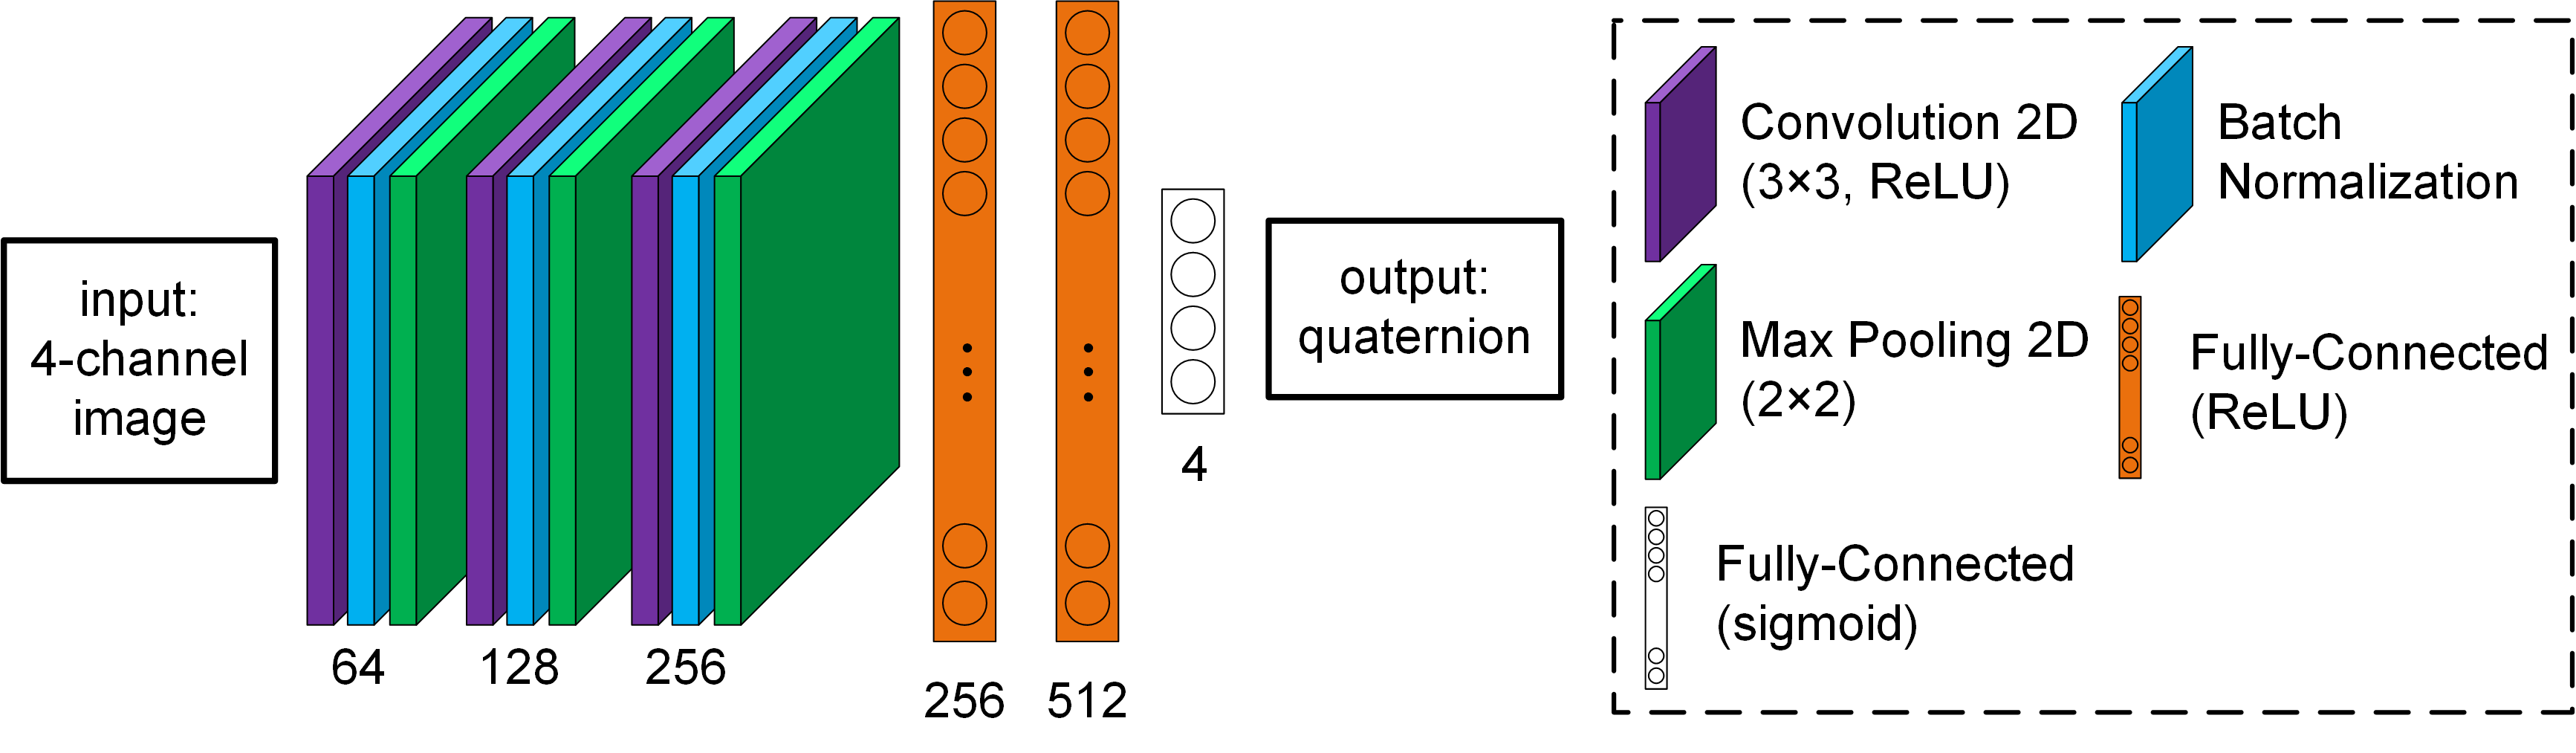
Figure 6. The CNN structure
The input data are normalized images, and the output data are their normalized quaternion values. There are three convolutional 2D layers in this structure, which can extract the features from images. And each convolutional layer is followed by the batch normalization to assist in training and a max-pooling 2D layer. Then, two fully connected layers are concatenated to infer the relationships between the features and the quaternion values. Lastly, a layer of 4 sigmoid activation functions is set as the output to generate the quaternion. The loss function is set as
\[L=\log(\sum_{i=1}^N(y_i-y ̂_i )^2 )\], where logarithm can magnify and distinguish small differences between loss values when the loss values become very small during training progress. We use Adam as the CNN training optimizer, and we only save the model parameters with the lowest training loss during training progress.
To compare the performance of our idea, we input three different types of images to create three different types of models. The first one is inputting only the RGB image with 3 channels from the left camera, the second one is inputting the RGB image from the left camera as well as the disparity map with total 4 channels, and the last one is inputting two RGB images from the two cameras with total 6 channels. We compare the training progress of the three different models. The results and the table of final training and validation losses are shown as follows.
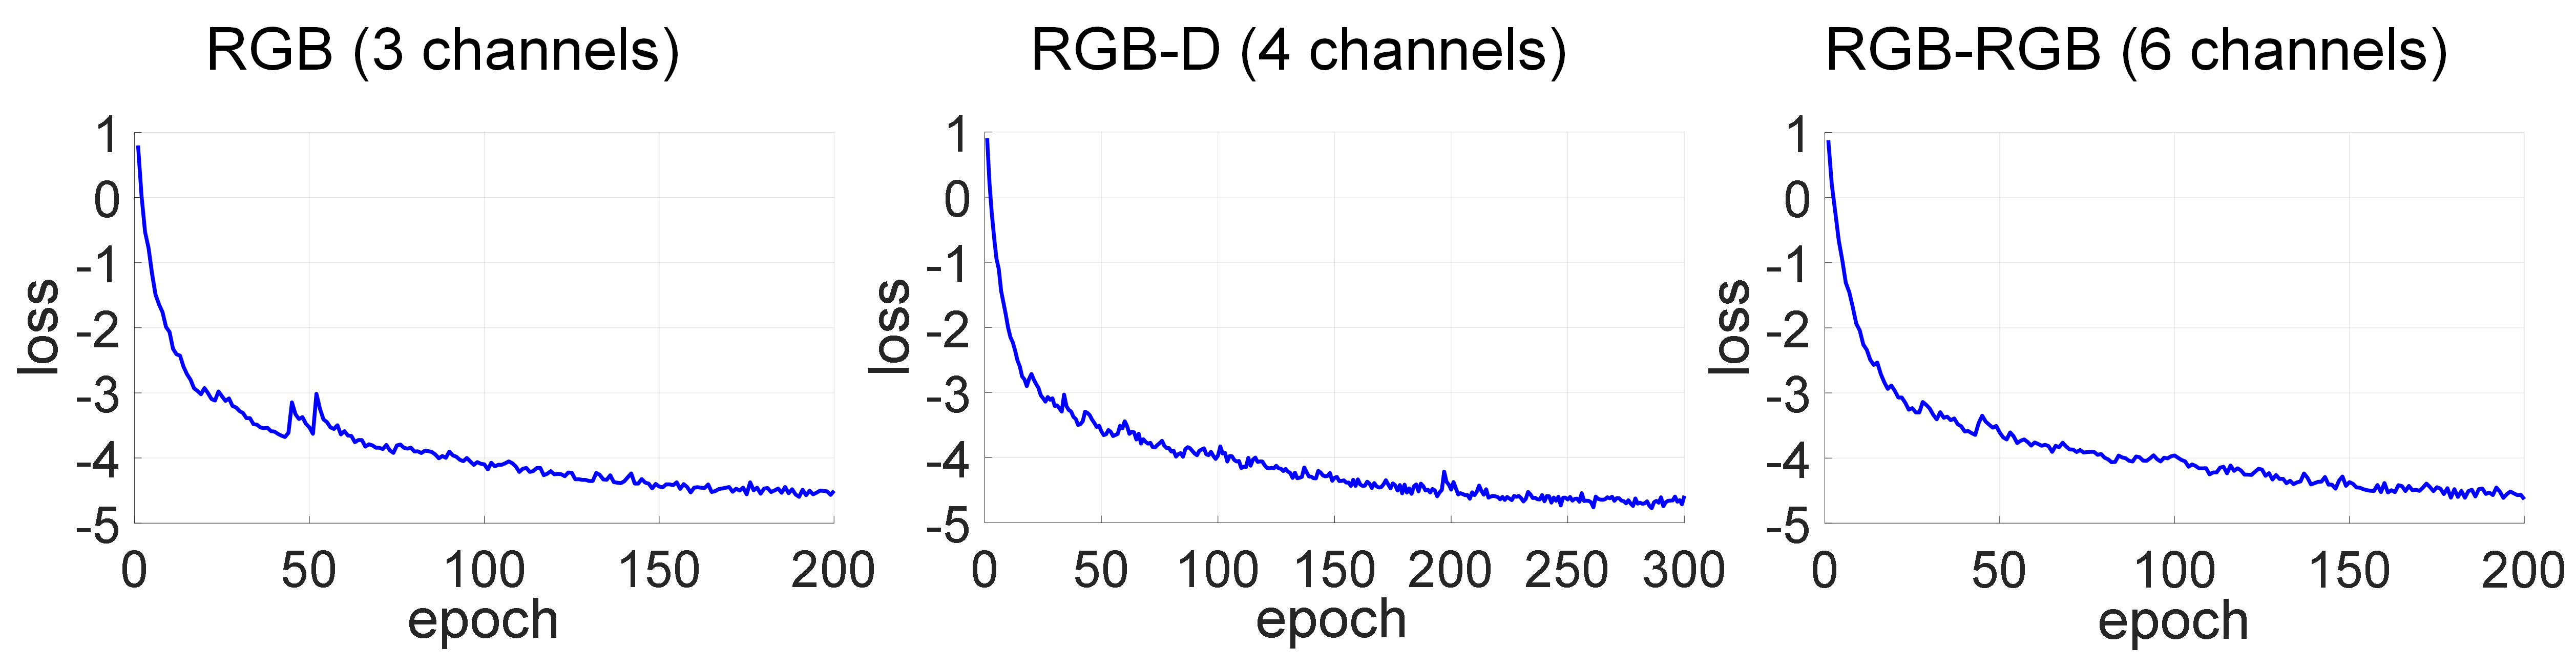
Figure 7: Prediction results of model with two-image-input
| RGB | RGB-D | RGB-RGB | |
|---|---|---|---|
| final training loss | -4.5035 | -4.5839 | -4.6329 |
| final valid loss | -4.7390 | -4.7038 | -4.9640 |
Table 1: Training and validation loss
The training progresses show that all the three models of different input image types are trainable since their training losses decrease as the epoch numbers grow. Besides from the table, the CNN model of two-RGB-image-input has the lowest final training and validation loss, indicating it may perform best. On the other hand, the model of RGBD-input has the highest validation loss, indicating that it may not be better than the model of only inputting an RGB image.
Since the model of two-RGB-image-input has the best indexes in this stage, we apply it on some randomly chosen validation data, and compare the plotted arrows of predicted axes and original label axes by visualization to judge its performance on predicting object pose. The following figure shows the prediction results.
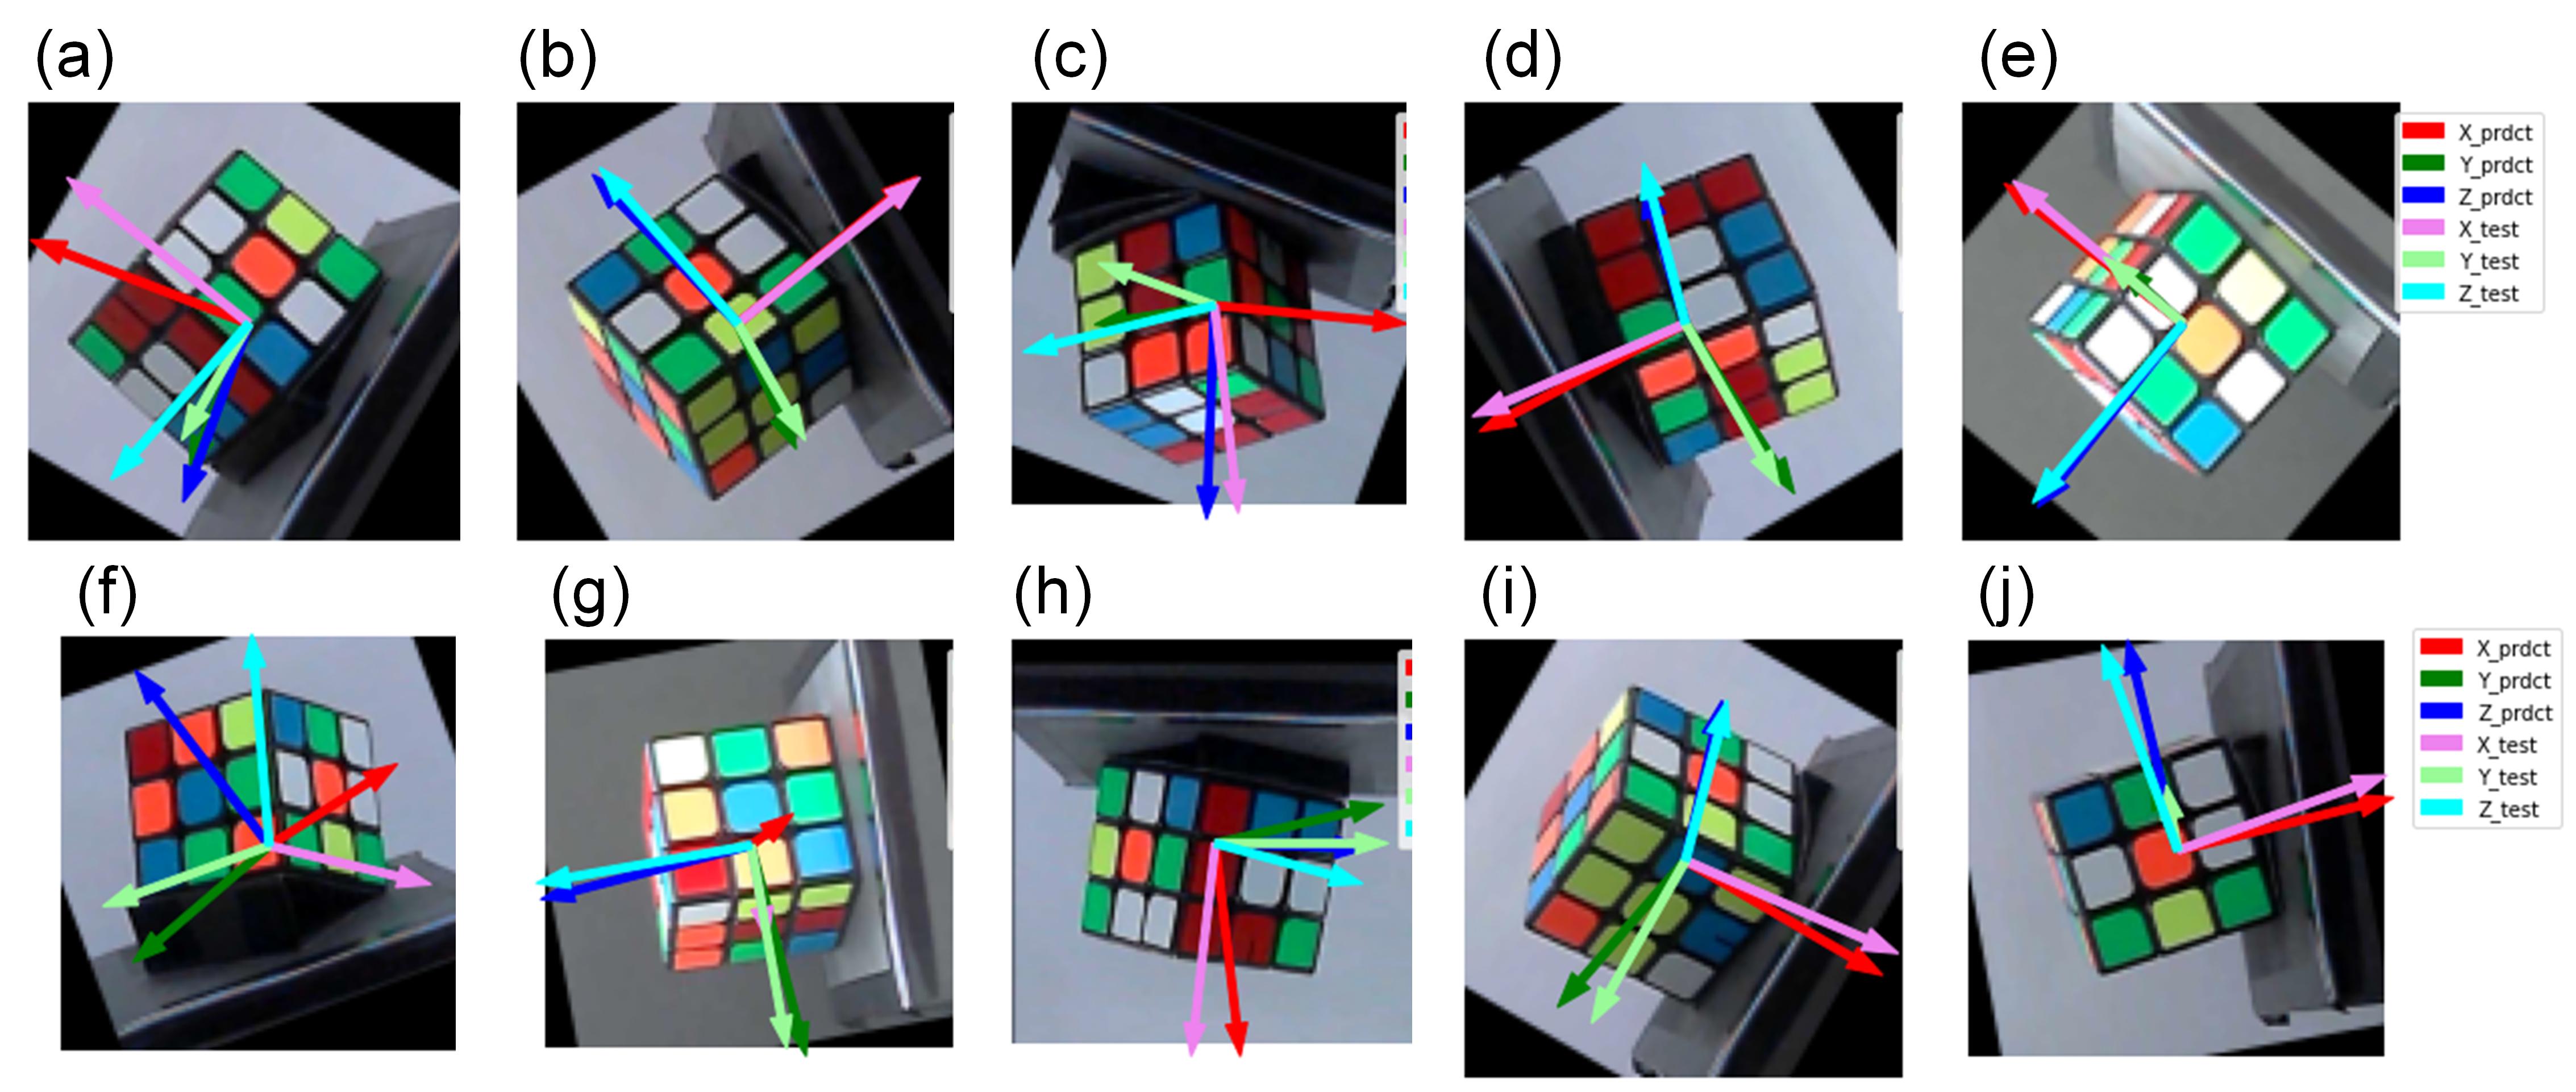
Figure 8: Prediction results of model with two-image-input
The images above are using the left images from the two paired images of each validation data for visualization. And, the figure shows that for some images, like (b), (d), and (e), the model can predict the object pose very well and make the generated arrows align to the original ones. For some images, like (a) and (i), they have some degree biases between the corresponding arrows, indicating not predicting well. While for some images, like (f), it predicts totally wrong pose of the object.
So, the model could be not stable.
IV. Test on Video: Result
Finally, we compare the three models by applying them on a series of recorded images. In the beginning of the video, the cube was placed on the black podium with its X, Y, and Z-axis of its body-fixed frame right along the directions pointing out (X-axis of the global frame), left (Y-axis of the global frame), and up (Z-axis of the global frame) of the images. Then, we took the cube out and arbitrarily rotated and moved it in the scene for a duration of time. And then, the models should predict the object poses by plotting the colored arrows (red arrow for X-axis, green arrow for Y-axis, and blue arrow for Z-axis) in correct directions. The following videos show the testing results.
model of one-RGB-image-input:
model of RGBD-input:
model of two-RGB-image-input:
These videos show that the model of one-RGB-image-input performs best. Most of its X-axis arrows were steadily attached perpendicular to the cube’s front face with its Y and Z-axes arrows lying on the front face the cube and pointing to the correct directions, indicating the model predicts the object pose well. While for the other two models, the arrows vibrate severely, and sometimes randomly point to totally wrong directions.
A. Discussion
We think there are some possible reasons which cause the model of one-RGB-image-input is better and more stable than the models of RGBD-input and two-RGB-image-input. Firstly, we trained our model under a relatively pure environment by placing the cube right in the center of the two cameras, while the cube moved a large lateral displacement in the testing video. So, the images from the right camera in the testing video might become noises and lower the model performance of two-RGB-image-input, since the cross section of the cube caught by the right camera after large displacement could not align that from the left camera as well as in the training data set.
Secondly, the information offered by the image from the left camera may be enough to judge the object pose, so the disparity map cannot facilitate the prediction to perform better. And it even could become a distractor and offer noisy information during testing. Besides, the patterns of the cube might be too complicated for the model. We may need to use an object with plainer colors, and so it can show the advantages of using the disparity map.
V. Conclusion
In this project, we used two webcams to build the RGBD vision system to achieve a cheaper solution, and utilized the CNN structure to predict the object pose based on the images from the vision system. After setting up the two-webcam system, we built the training dataset by using a Rubik’s Cube and rotating with different angles and took photos for it. Then, we constructed a CNN model and compare the performance by using three different image type of inputs. After training the model based on the dataset, results show that by inputting only one RGB image, it is good and stable enough to predict the object pose in 3D space.
However, there are some future works that could be done to improve our project. Firstly, we can add the function of predicting object position in the structure. Besides, we can use a robot arm to help us automate the procedure of building the training dataset in a more precise and efficient way. Lastly, since the model still cannot predict object pose precisely, it is possible to achieve more precise results that we can, at first, roughly predict the object pose based on CNN model, and then precisely predict the pose by using traditional methods, that is, a combinational structure.
References
[1] Papers With Code, “6D Pose Estimation using RGBD, “ accessed on: Sep. 29, 2020. [Online]. Available: https://paperswithcode.com/task/6d-pose-estimation-using-rgbd
[2] C. Finn, Xin Yu Tan, Yan Duan, T. Darrell, S. Levine and P. Abbeel, “Deep spatial autoencoders for visuomotor learning,” IEEE International Conference on Robotics and Automation (ICRA), Stockholm, 2016, pp. 512-519, doi: 10.1109/ICRA.2016.7487173.
[3] Y. Xiang, T. Schmidt, V. Narayanan, and D. Fox, “PoseCNN: A Convolutional Neural Network for 6D Object Pose Estimation in Cluttered Scenes,” arXiv:1711.00199v3, 2018.
[4] C. Wang et al., “DenseFusion: 6D Object Pose Estimation by Iterative Dense Fusion,” IEEE/CVF Conference on Computer Vision and Pattern Recognition (CVPR), CA, USA, 2019, pp. 3338-3347. doi: 10.1109/CVPR.2019.00346.